

Designing ER diagram charts in Canva is easy with our step-by-step guide. Visualize your database relationships like a pro!
Canva Articles on Charts, Graphs, & Tables
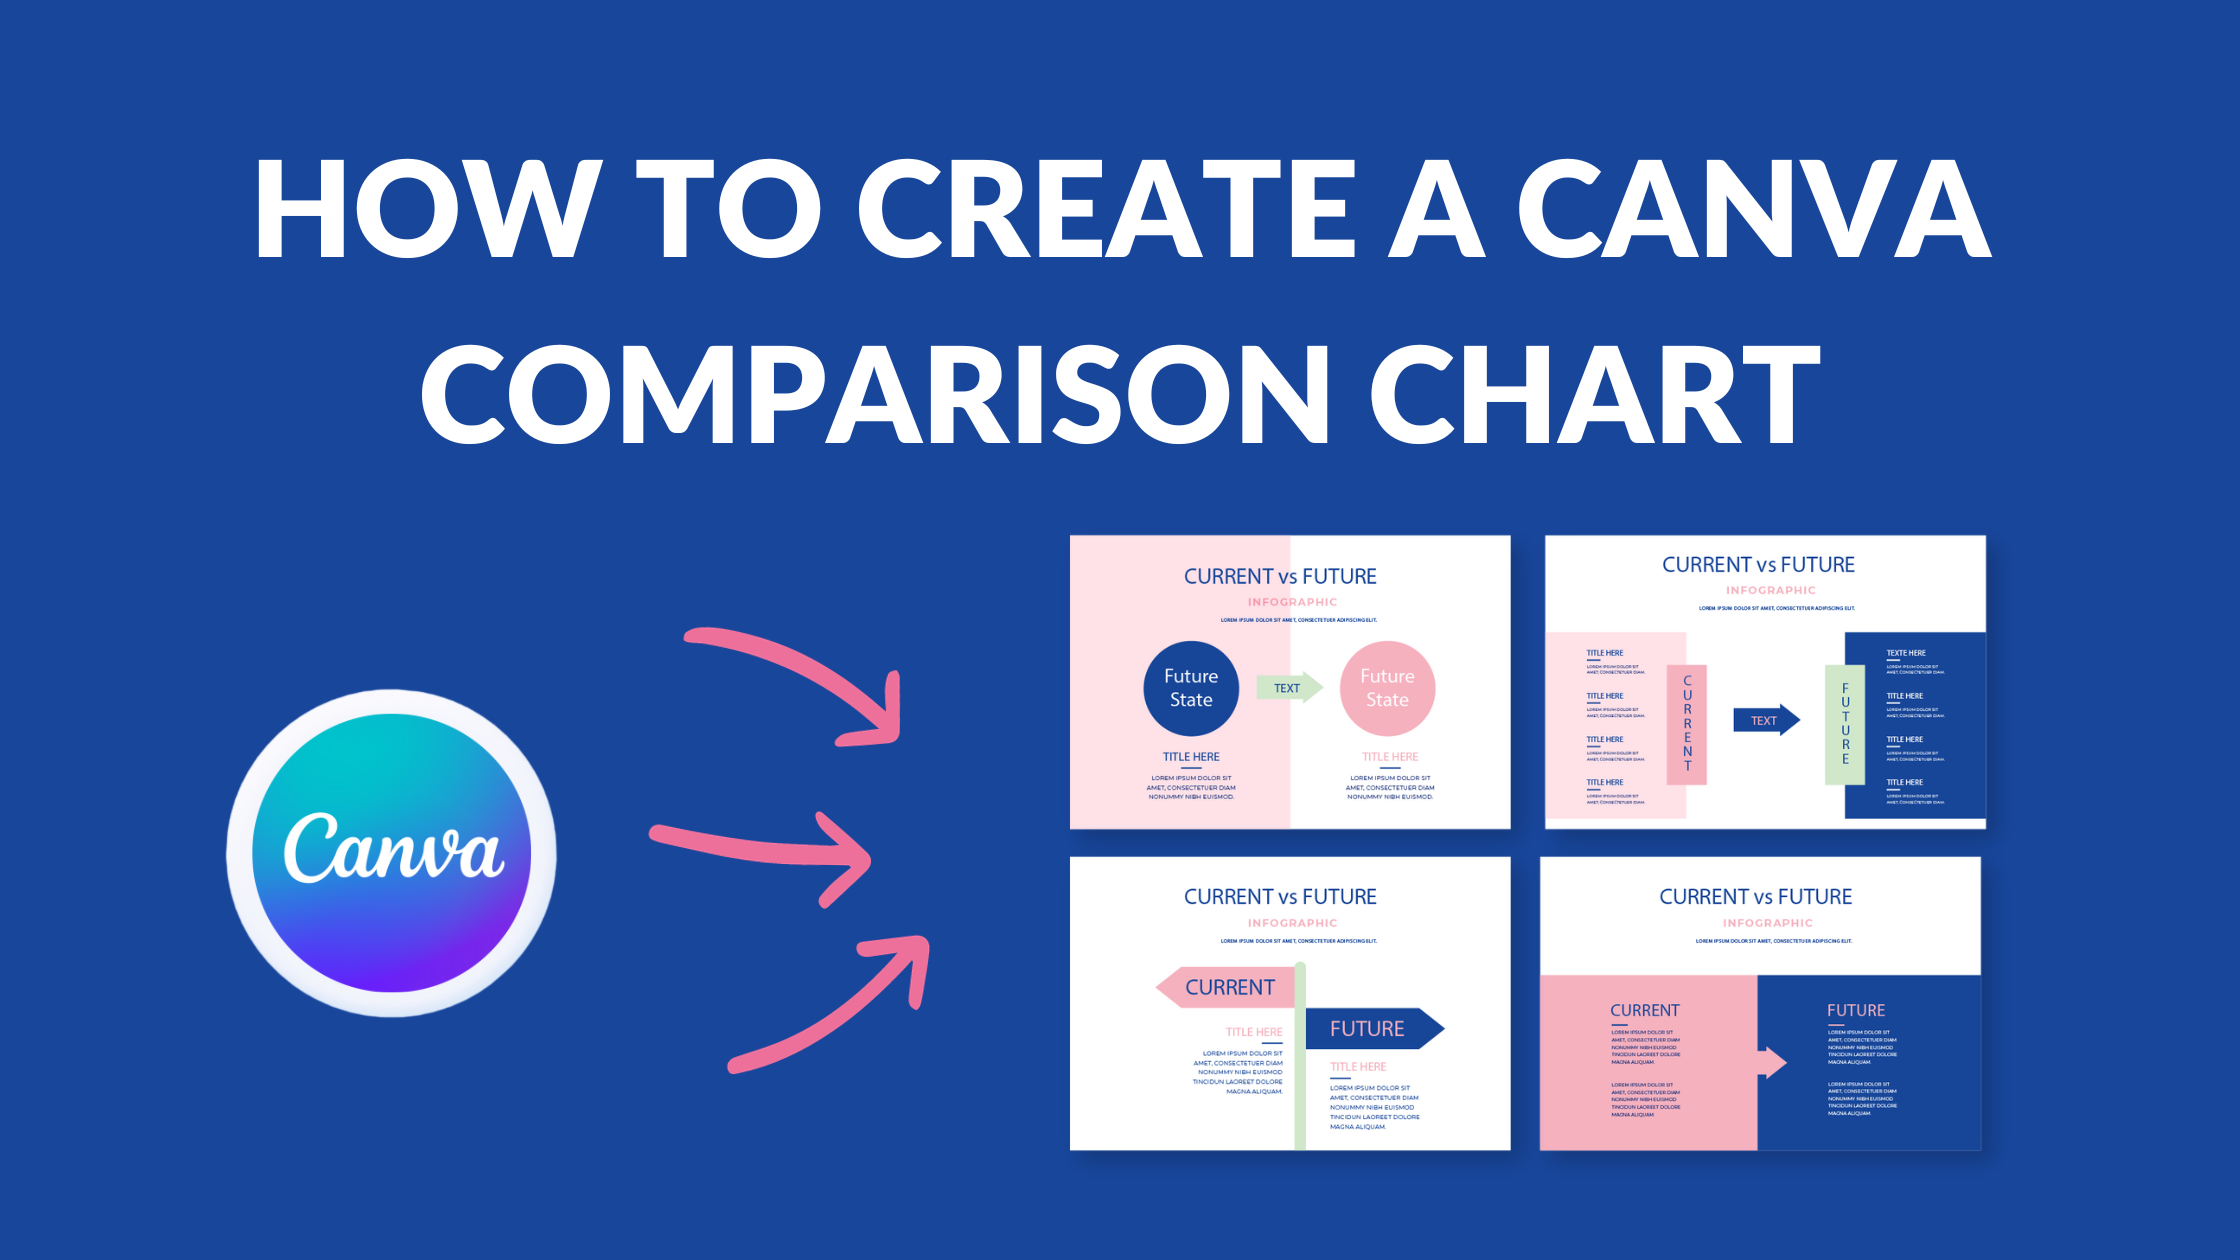
Create compelling comparison charts in Canva effortlessly. Elevate your visual presentations with our comprehensive guide.

Learn how to make a bar graph in Canva with our step-by-step guide. Create stunning visuals that convey data using custom graphs!
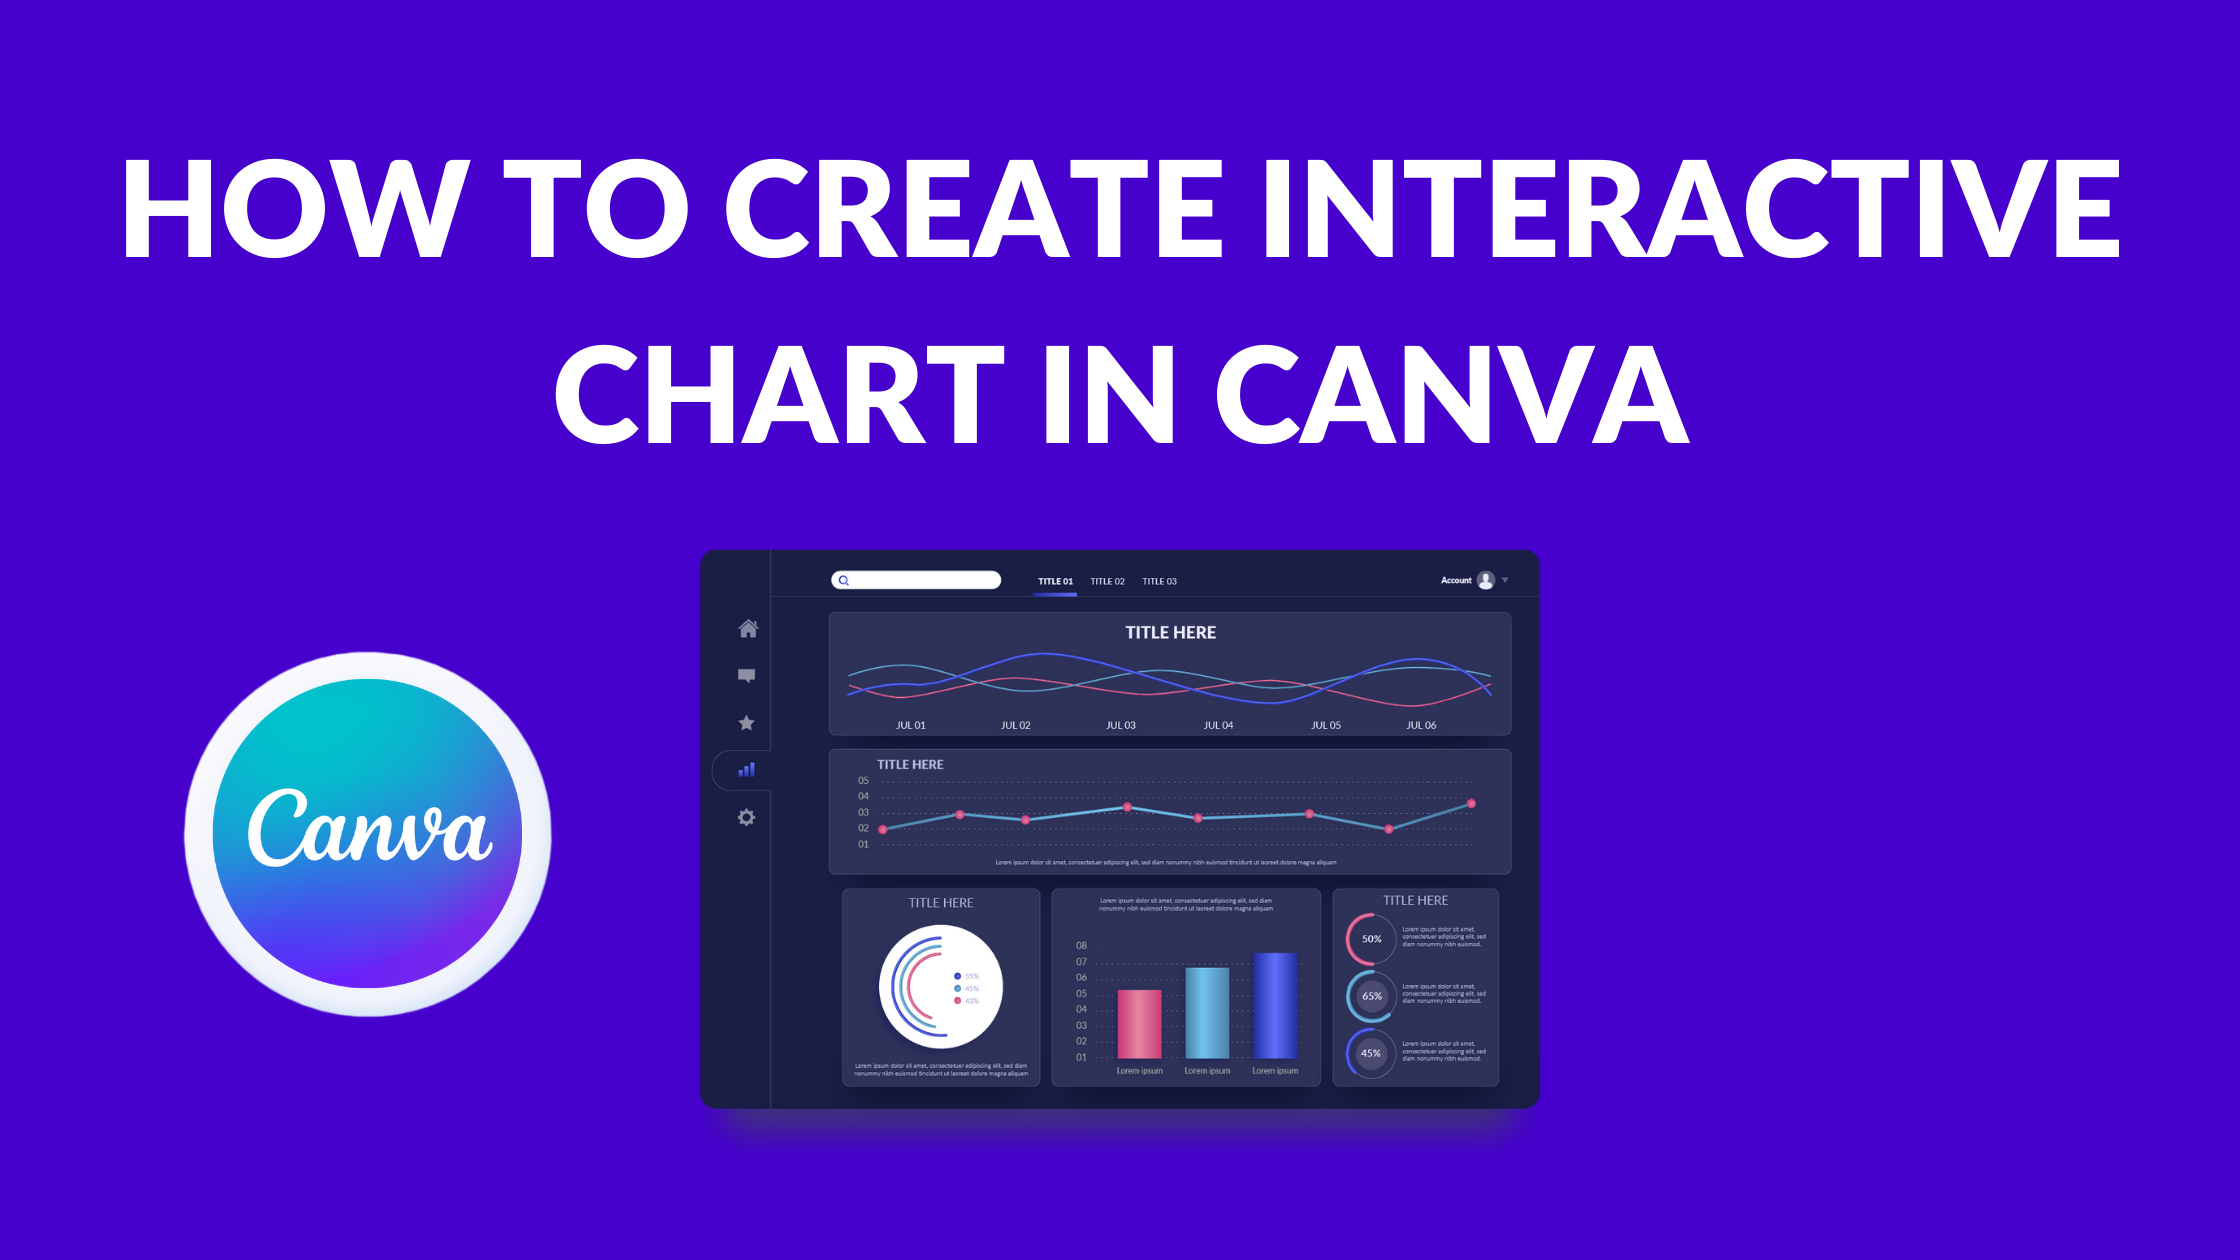
Unlock interactivity in your Canva charts! Learn how to create interactive charts with our tutorial. Engage your audience like never before.
Visualize your data with Canva graphs. Our latest blog post teaches you how to create them effortlessly.
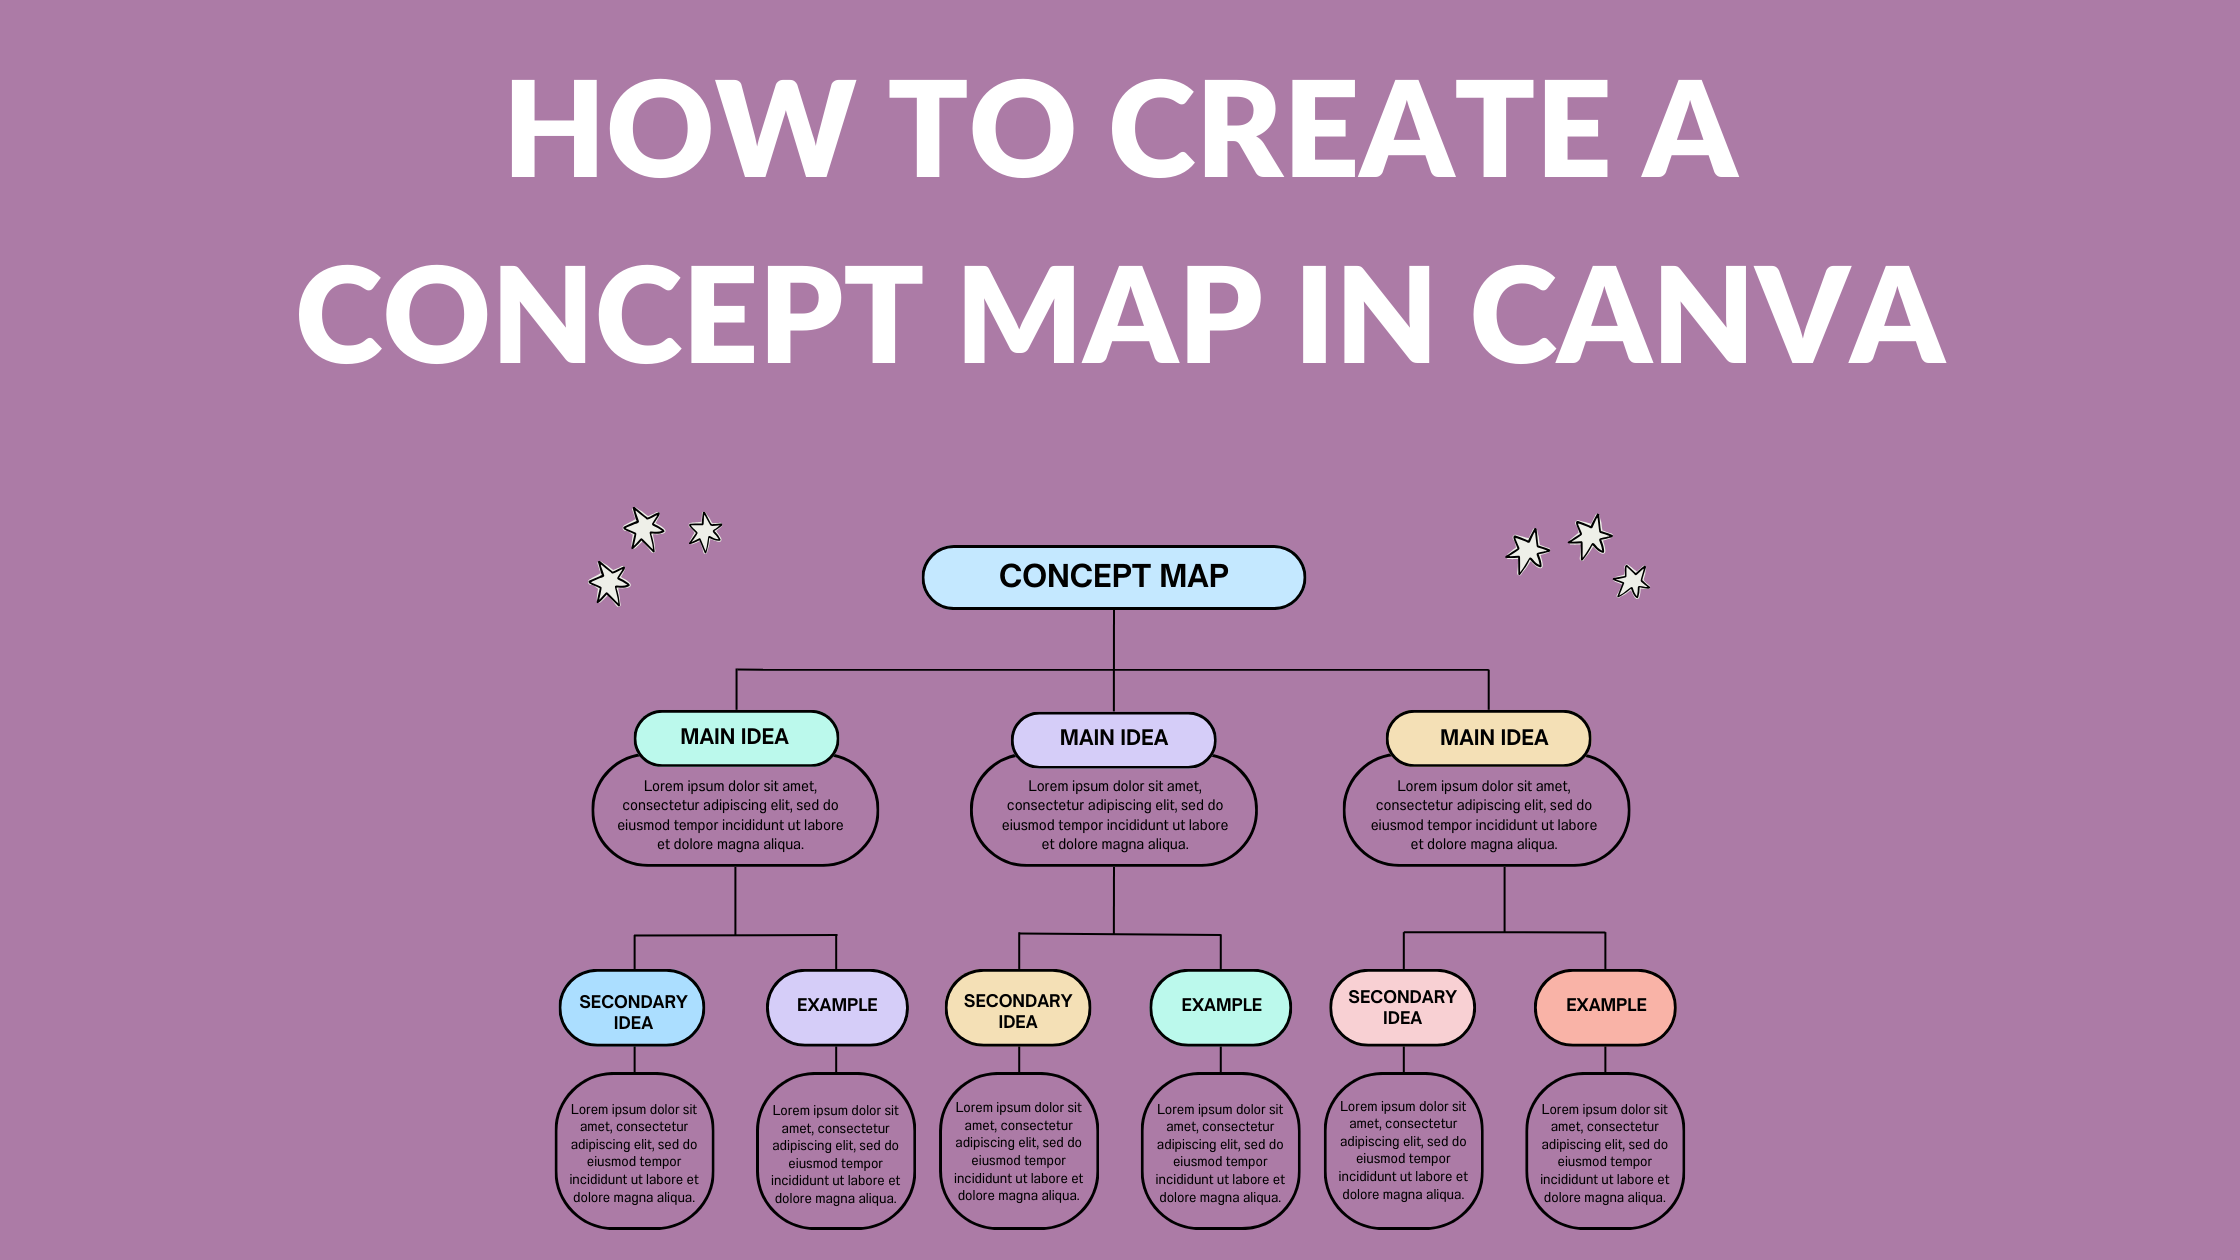
Discover how to create a concept map in Canva. Organize and visualize your ideas and information effectively with this step-by-step guide.
Discover how to craft a Gantt chart in Canva effortlessly. Follow our expert guide for effective project planning!

Master the art of creating line graphs in Canva. Follow our simple steps to visualize data beautifully. Design professional charts today!
Bring data to life! Learn how to make a chart in Canva from Google Sheets and visualise your data effectively.

Track events chronologically! Discover the secrets to crafting timelines that tell stories, using Canva’s tools.