
Unlock the power of cycle diagrams in Canva with our step-by-step guide. Visualize processes and concepts seamlessly.
Canva Articles on Charts, Graphs, & Tables
Learn how to craft a Fishbone Diagram in Canva for effective problem-solving. Dive into our step-by-step guide now!
Learn to design eye-catching pictograms in Canva with our easy-to-follow tutorial. Elevate your visual communication effortlessly.

Learn how to make a donut chart in Canva with step-by-step instructions. Create stunning visuals effortlessly.

Design strategic success with Canva. Discover how to create a Strategy Map step by step and chart your path to excellence.
Learn how to craft a SWOT analysis in Canva. Our guide helps you evaluate strengths, weaknesses, opportunities, and threats effectively.

Create block diagram charts in Canva with ease. Our comprehensive guide walks you through the process for clear visual representation.

Craft engaging bubble maps in Canva effortlessly. Follow our step-by-step guide to visualize data with impact.

Learn how to design decision trees in Canva step by step. Make informed choices with our visual decision-making guide.
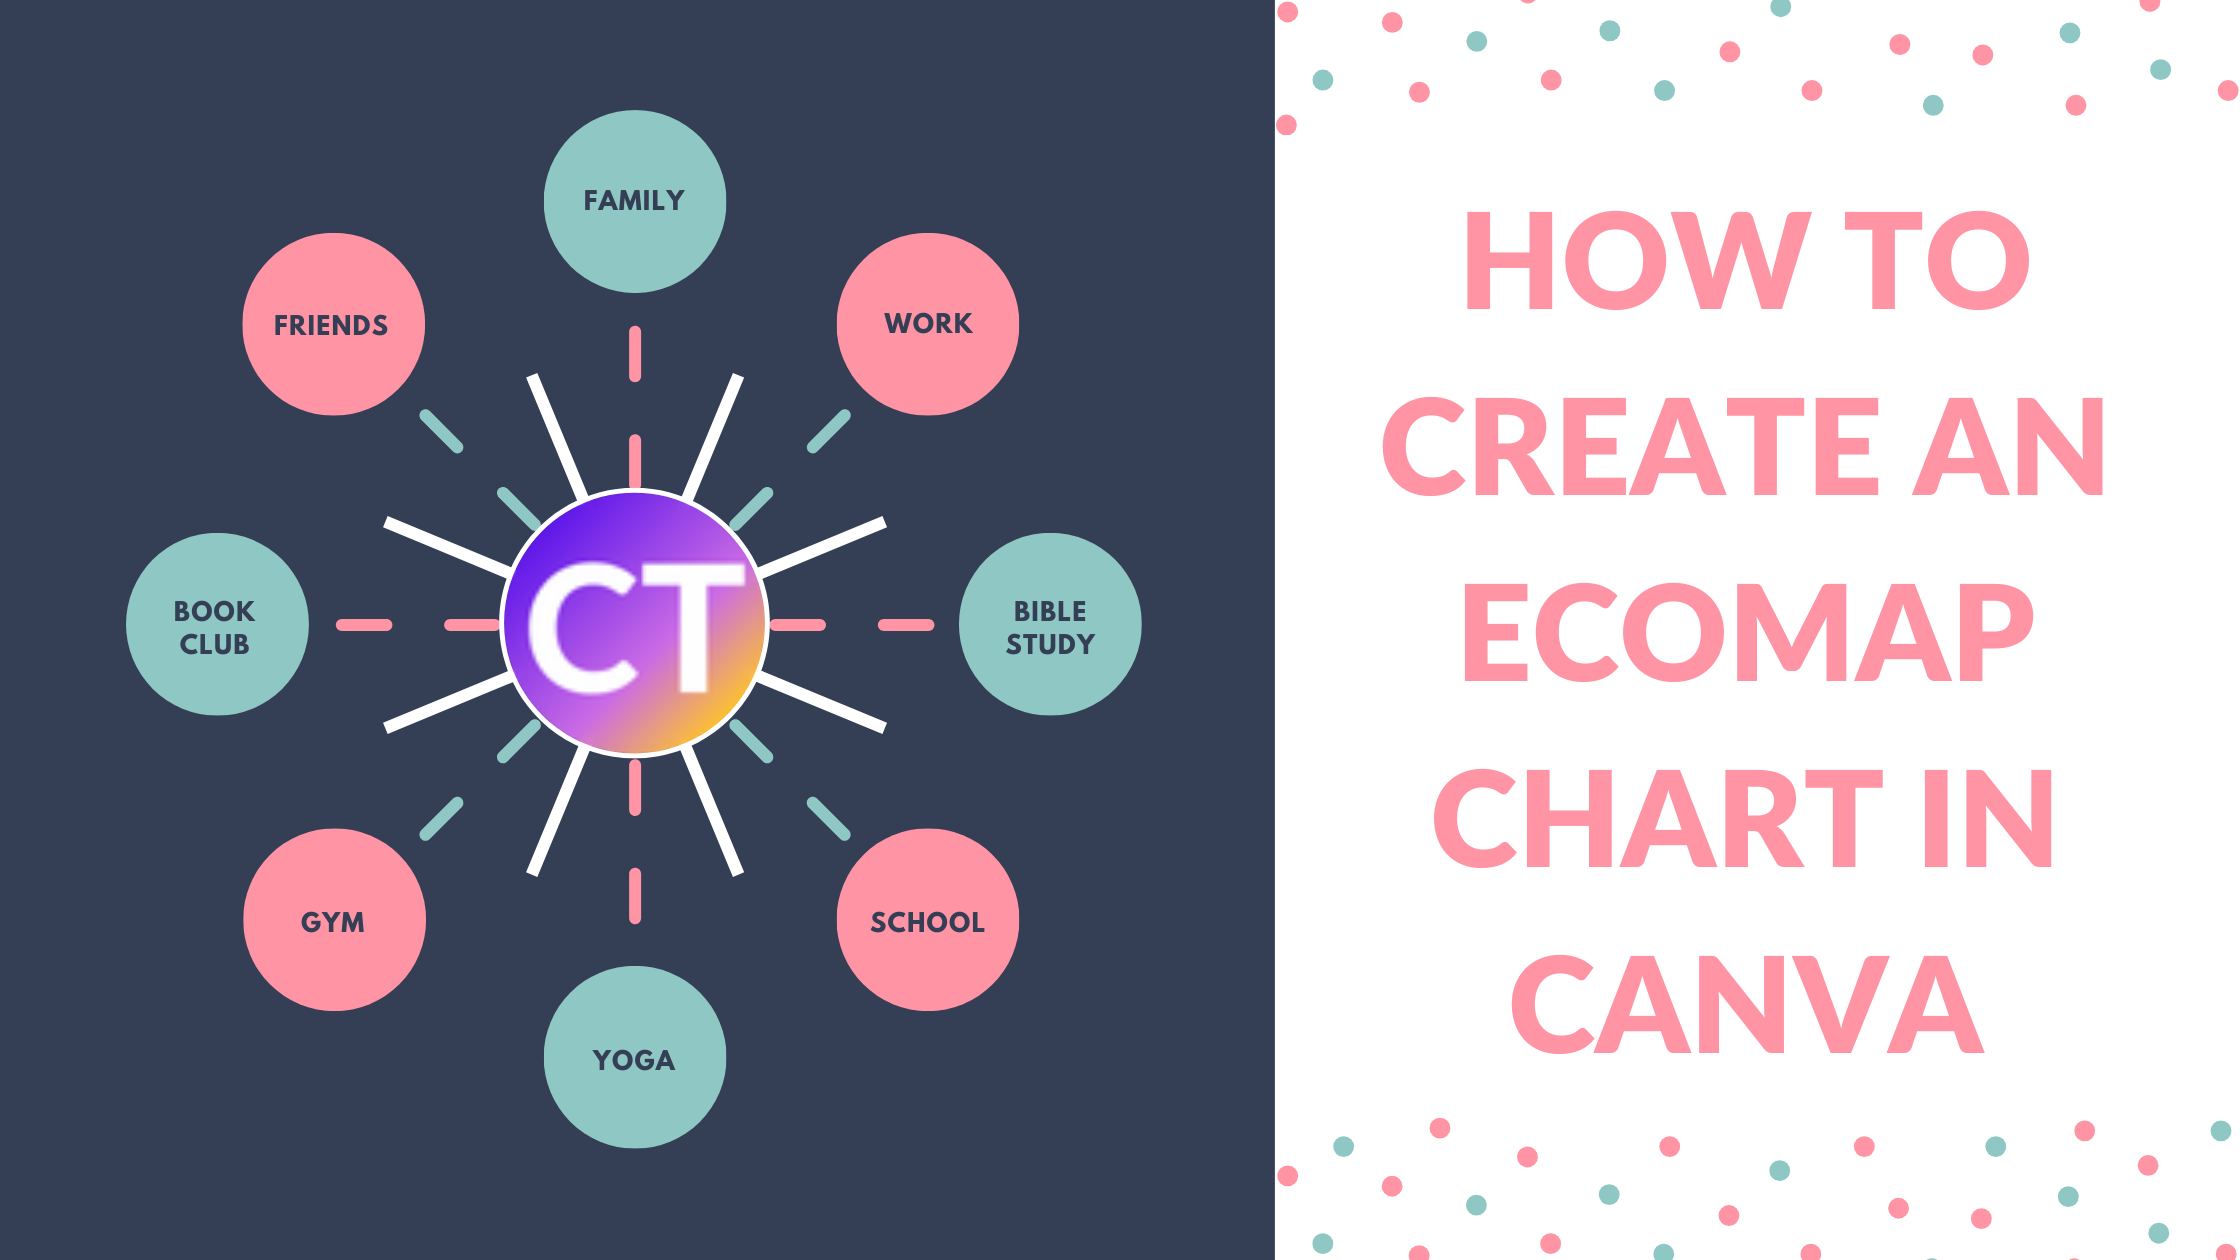
Create insightful ecomap charts in Canva effortlessly. Follow our step-by-step guide to visualize relationships and connections.